qiskit.visualization.plot_state_hinton
qiskit.visualization.plot_state_hinton(state, title='', figsize=None, ax_real=None, ax_imag=None, *, filename=None)
Plot a hinton diagram for the density matrix of a quantum state.
The hinton diagram represents the values of a matrix using squares, whose size indicate the magnitude of their corresponding value and their color, its sign. A white square means the value is positive and a black one means negative.
Parameters
- state (Statevector orDensityMatrix or ndarray) – An N-qubit quantum state.
- title (str(opens in a new tab)) – a string that represents the plot title
- figsize (tuple(opens in a new tab)) – Figure size in inches.
- filename (str(opens in a new tab)) – file path to save image to.
- ax_real (matplotlib.axes.Axes(opens in a new tab)) – An optional Axes object to be used for the visualization output. If none is specified a new matplotlib Figure will be created and used. If this is specified without an ax_imag only the real component plot will be generated. Additionally, if specified there will be no returned Figure since it is redundant.
- ax_imag (matplotlib.axes.Axes(opens in a new tab)) – An optional Axes object to be used for the visualization output. If none is specified a new matplotlib Figure will be created and used. If this is specified without an ax_imag only the real component plot will be generated. Additionally, if specified there will be no returned Figure since it is redundant.
Returns
The matplotlib.Figure of the visualization if neither ax_real or ax_imag is set.
Return type
matplotlib.figure.Figure(opens in a new tab)
Raises
- MissingOptionalLibraryError – Requires matplotlib.
- VisualizationError – if input is not a valid N-qubit state.
Examples
import numpy as np
from qiskit import QuantumCircuit
from qiskit.quantum_info import DensityMatrix
from qiskit.visualization import plot_state_hinton

qc = QuantumCircuit(2)
qc.h([0, 1])
qc.cz(0,1)
qc.ry(np.pi/3 , 0)
qc.rx(np.pi/5, 1)

state = DensityMatrix(qc)
plot_state_hinton(state, title="New Hinton Plot")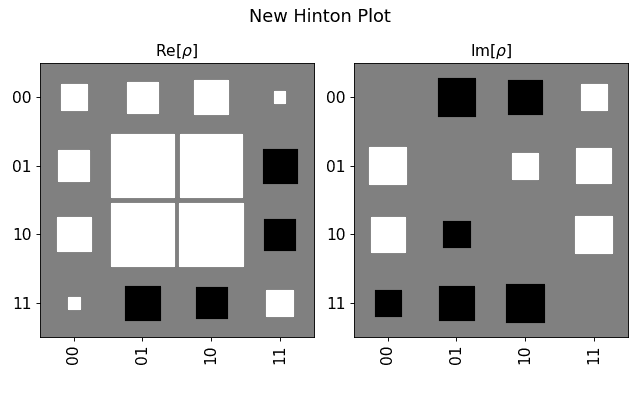
Was this page helpful?
Report a bug or request content on GitHub.